Legal-X Dashboard Project
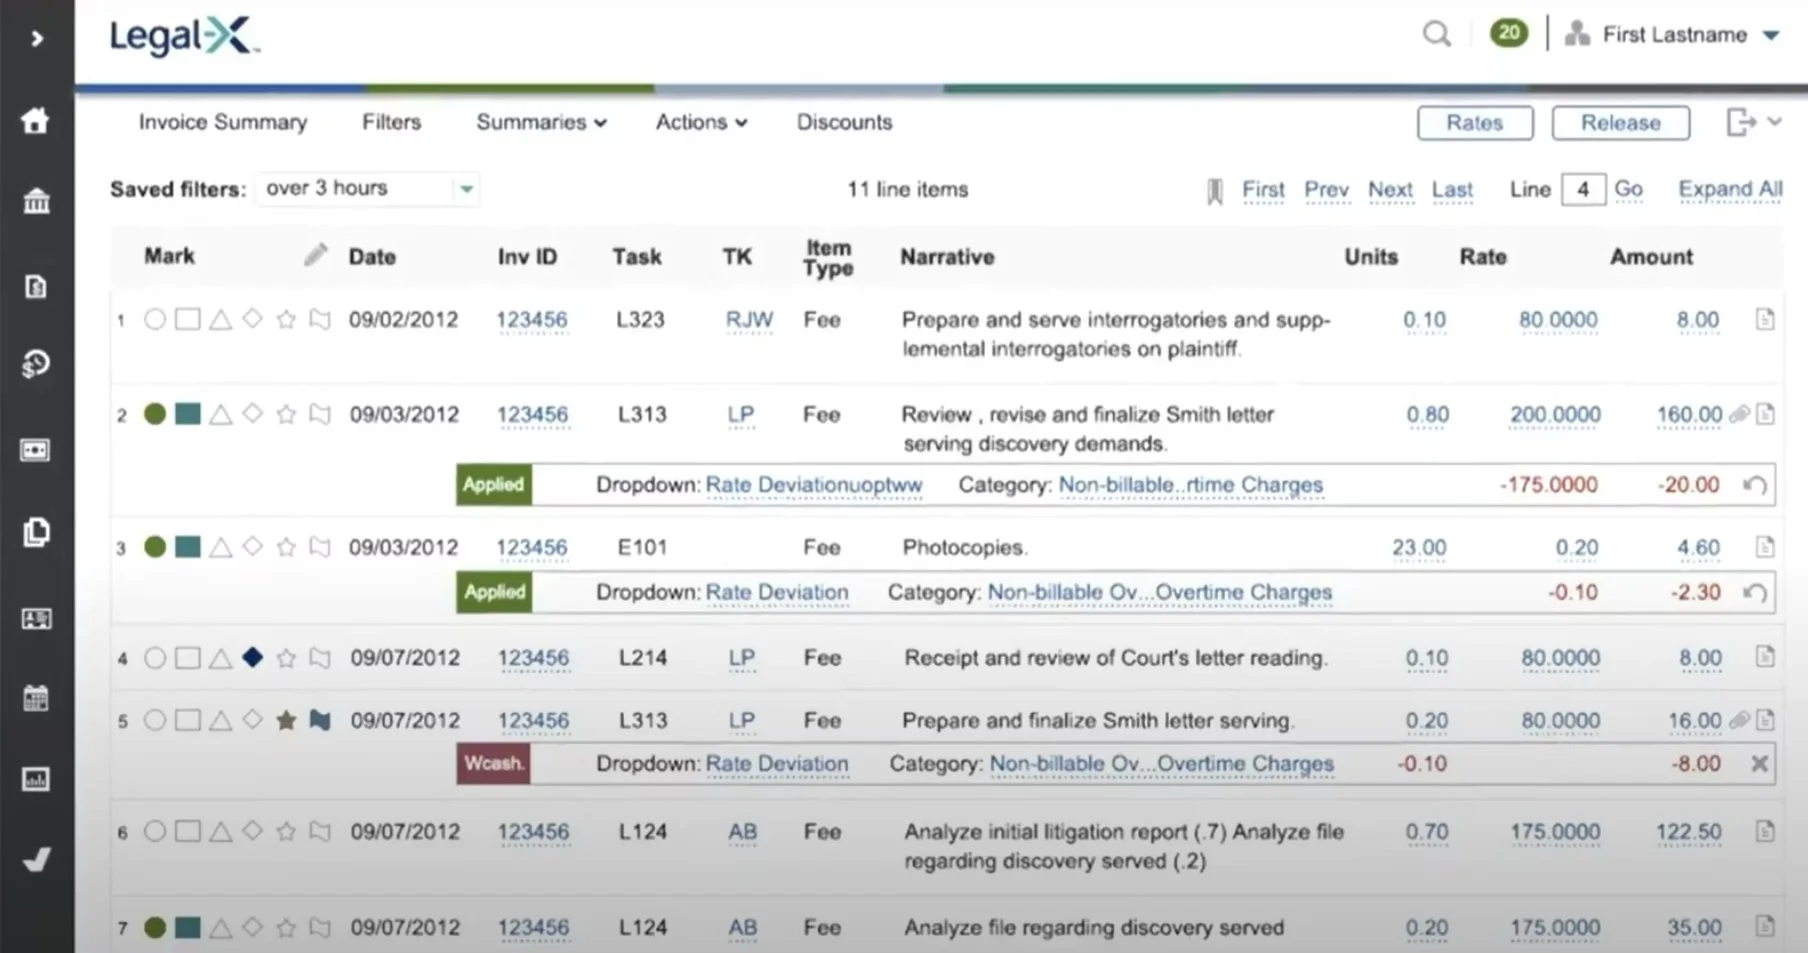
The original Legal-X dashboard relied heavily on a large, data-dense table, prioritizing completeness over clarity and making it challenging for users to scan, prioritize, and act efficiently.
Company
Bottomline Technologies
Problem & Context
Legal-X auditors are responsible for reviewing, prioritizing, and releasing high volumes of invoices and appeals across multiple client accounts. As Bottomline rolled out a newly branded UI across its legal product suite, the existing Legal-X dashboard no longer supported the scale or complexity of auditors’ day-to-day workflows.
Auditors struggled to quickly understand workload priority, access the right level of detail for auditing tasks, and respond efficiently to client and firm inquiries. Fragmented information, limited visibility into queue size, and system delays slowed invoice release velocity and increased cognitive load, directly impacting operational efficiency and user satisfaction.
This work focused on redesigning the Legal-X dashboard to better support high-volume, time-sensitive auditing workflows while aligning with the new product brand and future platform direction.
My Role
I led product discovery and design execution for the Legal-X dashboard redesign, partnering closely with UX leadership, Product Management, and Engineering.
My responsibilities included:
Defining the problem space and success criteria with UX and Product leadership
Leading user research and synthesis with auditors and audit managers
Translating user insight into validated workflows, information hierarchy, and data visualizations
Creating personas, journey maps, user flows, and high-fidelity dashboard designs
Aligning design decisions to measurable business and operational outcomes

User interview questions reviewed with our EBR Auditor team, who is the primary user group.

Auditor, primary user for Legal-X. I created this persona in partnership with product.

Value Proposition Canvas - Understanding how the product is positioned with the user values and needs.

Invoice productivity reports gathered from users to identify average workload queues to account for in design phase.

Journey map identifying user goals

Existing user flow I created to show all the interactions from the dashboard

New user flow to simplify the experience and improve efficiency for users
Approach & Key Decisions
To ground design decisions in real auditor behavior, I led a structured discovery and synthesis process:
Planned and facilitated user interviews with auditors and audit managers, including review of interview questions with the EBR Auditor team
Created an auditor persona in partnership with Product to represent primary user goals, constraints, and motivations
Developed a value proposition canvas to align user needs with product and business value
Analyzed invoice productivity reports to understand average queue sizes, workload variability, and throughput expectations
Mapped the end-to-end auditor journey and existing dashboard user flows to identify friction points and inefficiencies
Key decisions included:
Designing for prioritization first, not feature exposure
Treating the dashboard as an operational command center, not a reporting surface
Optimizing for scannability and speed to support large invoice volumes
Solution
The final solution delivered a redesigned Legal-X dashboard focused on clarity, prioritization, and efficiency at scale.
Key improvements included:
A simplified dashboard layout that reduced cognitive load by removing low-value or redundant widgets
Clear prioritization of critical metrics needed to audit and release invoices efficiently
Improved data visualization to help auditors quickly assess queue size, workload distribution, and urgency
Streamlined user flows that reduced unnecessary navigation between dashboard and task-level views
Filtering and personalization controls that allowed auditors to focus on the right work at the right time
The final designs included validated user flows, refined interaction models, and functional data visualizations, reviewed and iterated with Product, Engineering, and UX leadership to ensure feasibility and scalability.

Final dashboard design with functional data visualization.
Outcomes & Impact
The redesigned Legal-X dashboard improved auditor efficiency and set the post-rebrand direction for the product.
10% increase in invoices released per auditor per week
Faster identification of high-priority invoices through clearer workload visibility
Reduced cognitive load across high-volume auditing workflows
Positive auditor feedback citing improved clarity, confidence, and speed
Established a scalable dashboard framework adopted across Bottomline’s legal products
Key Learnings
Aligning UX decisions to measurable business outcomes drives stronger adoption and operational impact
Reducing cognitive load is essential in enterprise, data-heavy workflows where speed and accuracy are critical
Dashboards designed around real operational workflows outperform feature-driven layouts
Early and consistent cross-functional alignment accelerates delivery and builds long-term trust in design direction